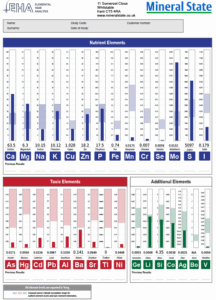
When you receive an HTMA report, it’s natural to look first at which individual minerals are high or low. But some of the most useful information can come from looking at the relationships between minerals.
Minerals don’t work independently. They interact with one another, and the balance between two minerals can sometimes tell us something different from simply looking at their individual levels.
This is why mineral ratios form such an important part of the way I interpret a Hair Tissue Mineral Analysis.
Why do mineral ratios matter?
You could have two minerals that both fall within their individual reference ranges, yet the relationship between them may still be out of balance.
Conversely, an individual mineral may appear high or low but looking at the minerals around it can help us put that result into context.
Sodium to Potassium (Na/K) – a key HTMA ratio
The sodium-to-potassium ratio is one of the most important ratios I look at when interpreting HTMA.
Sodium and potassium are crucial electrolytes involved in the movement of substances in and out of cells. You can think of them as being part of the body’s cellular gatekeeping system.
Across cell membranes, sodium and potassium gradients are maintained by mechanisms including the sodium-potassium pump. These gradients are fundamental to nerve signaling, muscle contraction, fluid balance and normal cellular activity.
Within HTMA interpretation, the relationship between sodium and potassium is used as one piece of the overall picture when considering vitality, stress patterns and mineral balance.
Calcium to Magnesium (Ca/Mg) – the ‘blood sugar ratio’
The calcium-to-magnesium ratio is traditionally referred to within HTMA as the blood sugar ratio.
Both minerals have important roles in areas such as muscle and nerve function, energy metabolism and glucose regulation.
The Ca/Mg ratio can give us clues that blood sugar regulation may be under pressure, sometimes at a stage when conventional blood markers are still within their reference ranges. Rather than diagnosing a blood sugar problem, it gives us an opportunity to look more closely at diet, lifestyle and the wider mineral pattern, and to use blood glucose or HbA1c alongside this where appropriate.
Calcium to Potassium (Ca/K) – the ‘thyroid ratio’
The calcium-to-potassium ratio is commonly referred to in HTMA as the thyroid ratio.
The calcium-to-potassium ratio can give us useful clues about metabolic activity and how the body may be responding to thyroid hormones at a tissue level. This can be particularly interesting when someone is experiencing symptoms commonly associated with reduced thyroid activity – such as low energy, feeling cold, sluggishness or difficulty managing weight – yet their TSH and T4 remain within the laboratory reference ranges.
Rather than looking only at how much thyroid hormone is circulating in the blood, the Ca/K ratio gives us another piece of the metabolic picture. It doesn’t replace thyroid blood testing or directly measure thyroid hormone utilisation, but an altered ratio may help us understand why someone’s symptoms and conventional blood results don’t appear to tell quite the same story. Where appropriate, I would look at this alongside TSH, free T4, free T3 and thyroid antibodies, as well as the wider HTMA mineral pattern.
Sodium to Magnesium (Na/Mg) – the ‘adrenal or stress ratio’
The sodium-to-magnesium ratio is one of the key relationships I look at when assessing someone’s stress pattern on an HTMA. It is traditionally known as the adrenal or stress ratio because sodium and magnesium are both closely involved in the body’s physiological response to stress.
Within HTMA interpretation, a higher Na/Mg ratio can be seen in a pattern where the body appears to be in a more heightened or activated stress response – what I often describe to clients as “running on stress”. Someone may still be pushing through, feeling wired, struggling to switch off or seemingly coping, but doing so at a significant physiological cost.
At the other end of the spectrum, a low Na/Mg ratio can form part of a more depleted stress pattern. This is where we may see someone who has been under prolonged pressure and no longer seems to have the same resilience or capacity to cope. They may describe feeling exhausted, overwhelmed or as though even relatively small stresses are now much harder to manage.
This is why I find the ratio particularly useful when looking at stress resilience. Two people can both tell me they’re stressed, but their mineral patterns can look quite different. One may appear to be in a more activated, high-stress pattern, while another may show a much more depleted pattern after a prolonged period of stress.
I will also look at Na/Mg alongside the sodium-to-potassium ratio (Na/K), which is another particularly important marker within HTMA, as well as calcium, magnesium and the wider mineral pattern. Together, these relationships can give us a much more useful picture of stress, resilience and where nutritional and lifestyle support may be needed.
Zinc to Copper (Zn/Cu) – mood, hormones and balance
These two minerals need to remain in balance with one another and are involved in a number of pathways relating to hormones, neurotransmitters and nervous system function.
Zinc and copper are both involved in pathways associated with oestrogen, progesterone and testosterone, so their relationship can provide useful clues when we’re looking at hormone balance. This can be particularly interesting during perimenopause, when changing hormone patterns may be accompanied by changes in mood, anxiety, irritability, sleep and other symptoms.
They are also involved in pathways required for the production and metabolism of important neurotransmitters, including dopamine and noradrenaline. This makes the zinc-to-copper relationship particularly interesting when we’re looking at mood, behaviour, concentration and how somebody responds to stress.
In my work with children, including children with ADHD, this is one of the mineral relationships I pay particular attention to. An altered Zn/Cu pattern doesn’t diagnose ADHD or tell us that it is the cause of a child’s symptoms, but it can provide another useful clue when we’re trying to understand the nutritional and biochemical picture behind areas such as attention, mood, emotional regulation and behaviour.
Equally, in an adult experiencing perimenopausal mood changes, an altered zinc-to-copper relationship may give us another piece of the puzzle when considered alongside their symptoms, hormone status, diet and the rest of their HTMA.
As with all HTMA ratios, I wouldn’t interpret Zn/Cu on its own. But when we put it together with the other mineral patterns, it can give us valuable clues about hormone balance, neurotransmitter pathways, mood and nervous system function.
Iron to Copper (Fe/Cu) – iron metabolism and immune function
Iron and copper are involved in energy production and normal immune function.
They also have a particularly important relationship because having iron available is only part of the story – the body also needs to be able to transport and utilise it effectively. Copper is involved in normal iron metabolism and mobilisation, so looking at these two minerals together can sometimes give us useful additional clues.
This can be particularly interesting when someone has been supplementing with iron but doesn’t appear to be getting the improvement they expected, or when their symptoms and blood results don’t seem to tell the whole story. Rather than simply asking, “Do we need more iron?”, the HTMA pattern can prompt us to consider the wider picture around iron transport, utilisation and the other nutrients involved in iron metabolism.
An HTMA iron result or Fe/Cu ratio isn’t a substitute for a full iron panel. Where iron deficiency or anaemia is suspected, I would still want to look at appropriate blood markers such as haemoglobin, ferritin, serum iron, transferrin or TIBC and transferrin saturation, alongside a full blood count where appropriate.
Iron and copper are also both closely connected with normal immune function, so the Fe/Cu relationship can be another interesting part of the HTMA picture when someone is experiencing ongoing immune challenges. Changes in the ratio may give us a reason to look more closely at what else is happening – including whether there are signs or symptoms suggesting an underlying infection or inflammatory process.
Putting the whole HTMA picture together
The real value of HTMA isn’t found in one high mineral, one low mineral or one ratio. It’s in the way all of those pieces fit together.
Each ratio gives us a different clue. We can look at patterns relating to stress and resilience, blood sugar regulation, metabolic and thyroid patterns, hormone and neurotransmitter pathways, iron utilisation and immune function. But none of these should be interpreted on their own.
I look at the individual mineral levels, the key ratios and how they relate to one another, before considering the overall pattern. I then put this into context with the person’s age, life stage, diet, supplements, lifestyle and stress levels, as well as symptoms, health history and other test results where these are available.
HTMA also measures a number of potentially toxic elements, such as lead, mercury, cadmium, aluminium and arsenic. We’re not going to explore these in detail here, but they are an important part of the overall picture. Exposure to toxic elements can interact with essential minerals and may influence how those minerals are utilised, so they always need to be considered alongside the nutritional elements and ratios.
This is why interpreting an HTMA is much more than simply looking down a report and identifying what’s inside or outside the reference range. We’re looking for relationships, patterns and trends – and asking what those patterns may be telling us about how the body is functioning and where it may need additional support.
After more than 25 years of using Hair Tissue Mineral Analysis in nutritional therapy, this is what I continue to find so valuable about the test: a relatively simple, non-invasive hair sample can give us a surprisingly detailed nutritional picture when all of the pieces are considered together.
Related article: